Test report DSG-6153 · Rev B · tested November 16, 2026
AI Datacenter InfrastructureDevice under test
403 U.S. Hyperscale Data Centers Emit 52.69M Tons of CO2
A Harvard-hosted study attributes 52.69 million metric tons of CO2 to 403 U.S. hyperscale data centers using 93.66 TWh, with fossil fuels driving nearly 60%.
- Read
- 5 min
- Words
- 939
- Node
- 7nm
- Operator
- Marcus Bennett
Spec summary
- 403 U.S. hyperscale data centers used 93.66 TWh of electricity.
- Attributed emissions reached 52.69 million metric tons of CO2.
- The estimate equals about 1.10% of 2023 U.S. electricity-consumption emissions.
- Almost 60% of attributed emissions came from fossil fuels.
- The sample covers about 78% of estimated 2024 hyperscale electricity use.
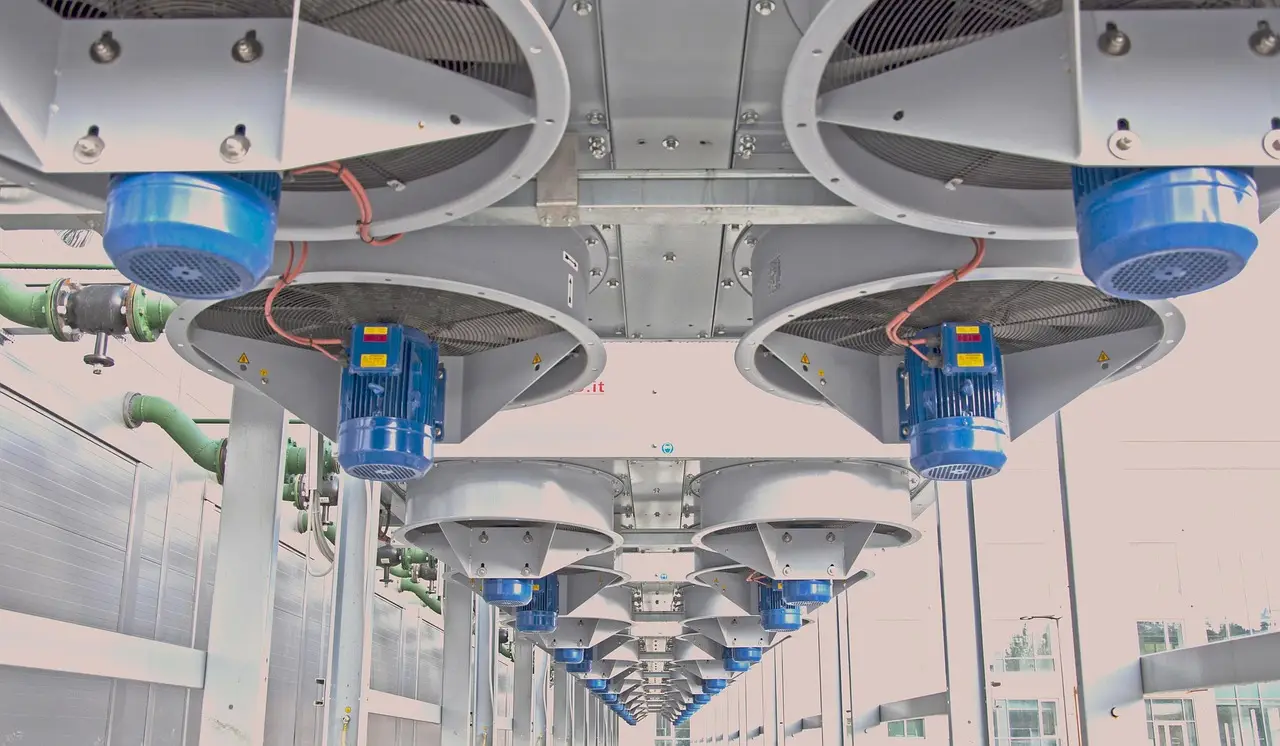
52.69 million metric tons of CO2 were attributed to 403 U.S. hyperscale data centers drawing 93.66 TWh, according to a Harvard-hosted report.
The study, titled “Assessing the Carbon Emissions of United States Hyperscale Data Centers,” covers facilities supporting public cloud, search, video, AI training and inference. It models grid emissions rather than reading meters at each site.
The authors called the result a “conservative lower bound.” They put it at about 1.10% of U.S. carbon emissions from electricity consumption in 2023, using the report’s own denominator. Almost 60% came from fossil fuels. Readers should check that denominator before reusing the share.
Why is the estimate a lower bound?
The 403 facilities cover roughly 78% of estimated U.S. hyperscale electricity use in 2024. If the missing 22% carried the same carbon intensity, the full hyperscale total would reach about 67.5 million tons. That extrapolation is our arithmetic, not a report figure, and it assumes similar grids.
Total U.S. data center use was about 200 TWh in 2024. Hyperscale sites supplied roughly 60%, or 120 TWh; the sample used 93.66 TWh, leaving about 26 TWh outside it and 80 TWh in non-hyperscale facilities. Smaller colocation halls, enterprise server rooms and edge sites sit outside the estimate.
How does electricity become CO2?
Nearly 60% of the total means roughly 30 million tons linked to coal and natural gas. Most data centers buy grid electricity rather than burn fuel onsite, so emissions depend on local generators and when servers draw power.
Dividing the published totals gives 0.56 kg of CO2 per kilowatt-hour. Our arithmetic gives a sample average of 232 GWh per facility annually, 26.5 MW of load and 131,000 tons of CO2. New AI campuses run higher, so these figures do not describe any named operator.
What does the Denmark comparison prove?
Reuters reported the study with a comparison to Denmark, which spread through social feeds. The available material does not establish whether the reference uses national emissions, power-sector emissions or another measure, or whether the accounting years and boundaries match.
No named speaker tied the comparison to a specific Danish statistic. Treat it as a rough scale marker, not a proven equivalence. The U.S. total remains usable because it rests on the report’s own facility count, electricity use and emissions model.
Why did emissions grow more than fivefold?
The report says its estimate is “more than five times the estimated emissions of hyperscale data centers in 2018.” Backward arithmetic puts the earlier estimate at or below about 10.5 million tons; again, that is our calculation rather than a published report value.
In 2018, the industry argued efficiency kept electricity use nearly flat. Virtualization, better cooling and custom chips softened the curve but did not offset rising demand. More floor space and denser AI accelerators drove the increase.
Operators signed record power deals and acquired land near generation. A cited TrueUp tally recorded 206,817 technology layoffs while putting AI infrastructure spending near $700 billion.
What changes for providers and communities?
The figure gives cloud providers, utilities and regulators a common measure for capacity debates. Carbon accounting can raise power-contract and offset costs. Permitting grows riskier when hearings cite 52.69 million tons, while enterprise buyers with net-zero targets inherit part of the footprint through cloud use.
Our market comparison put AWS at 26% share and 39% growth, versus Azure at 19% and 48%. Growth still outruns AI compute supply, and memory makers are locking capacity years ahead.
Local opposition already has force. Our reporting found 75 projects worth $130 billion blocked in one quarter; 40 of 41 midterm votes limited data-center growth. A 600 MW green-belt proposal in Havering angered London residents, while a $24 billion Starbase gas plant tests Texas behind-the-meter rules.
How can operators reduce emissions?
Location drives most of the carbon outcome. An identical 100 MW campus produces different emissions on a hydro-, wind- or nuclear-heavy grid than on a gas-heavy grid. The study’s fossil share suggests its sample generally sits where coal and gas carry most of the load.
Power purchase agreements and renewable certificates can reduce market-based claims, but they do not erase the physical footprint of power drawn from a fossil-heavy grid. Hourly matching pairs consumption with clean generation in the same grid and hour, which closes that gap, although few operators publish hourly figures.
The report provides no company-level emissions ranking, so naming the largest emitter would go beyond its evidence. Harvard’s Department of History of Science hosts the paper; author affiliations include Harvard’s T.H. Chan School of Public Health. It is neither a peer-reviewed journal article nor an official institutional statement.
What should cloud buyers do?
- Choose lower-carbon regions when latency and data-residency rules permit.
- Move batch jobs and training runs into cleaner grid hours.
- Right-size instances and shut down idle environments.
- Request location-based emissions data, not credit-based totals alone.
- Track emissions per unit of useful work.
Finance teams should treat 52.69 million tons as context for provider discussions, not a bill-level allocation.
What happens next?
We expect utility commissions and county boards to cite the estimate during large-load interconnection hearings within a year. Broader studies should raise the total unless grid carbon falls quickly. Hourly matching should spread, the Denmark shorthand should give way to narrower state comparisons, and grid carbon intensity should join megawatts and fiber in site selection.
These are forecasts, not findings from the report.
via shattered.io (Source)
More from Marcus Bennett
Show full bio
News editor covering regulation, policy and their impact on hardware layer of artificial intelligence at Die Signal.
681 articles
Same lot · LOT-362C
- DSG-305965nm403 US Data Centers Draw as Much Power as Austria
- DSG-664214nm403 U.S. hyperscale data centers used an estimated 82 TWh a year
- DSG-59857nmUS hyperscale data centers rival Denmark’s CO₂ output
- DSG-76493nmDatacenters to Triple Power Consumption by 2030: Gartner Data
- DSG-607114nmUK rejects Drax plan for 1.2GW AI data center at Selby plant